5 Years Later, Rural Electric Co-Ops Are Still Stuck in the Past
Rural cooperatives deliver electricity to some forty-two million Americans. These cooperatives were launched by the government during the New Deal to bring electricity to rural areas, where it wasn’t profitable for private companies. But, as was the case at the time of our previous investigation into these cooperatives1, their elected leadership woefully fails to reflect the membership.
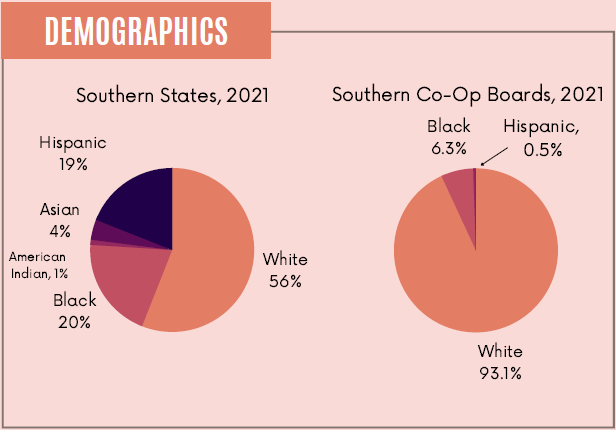
Co-Op Boards Remain Overwhelmingly White…
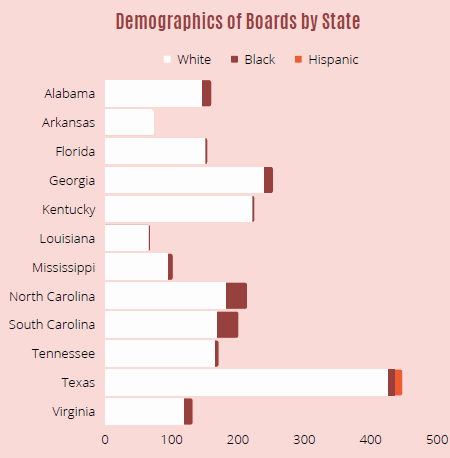
The states of the South are more racially diverse than America as a whole. Taken together, according to the latest figures from the Census Bureau, their population is just 56% white. Meanwhile, whites make up 93.1% of the boards of these states’ electricity co-ops. While fully 20% of the South’s residents are Black, only 6.3% of board members are. The discrepancy is even worse for Hispanics. At 19% of the South, they make up no more than 0.5% of boards. Our investigation, in fact, found that Texas was the only state with any Hispanic representation at all. In 2016, 6 of 3051 identified board members throughout the entire South were Hispanic; that number went up by just 7 in the intervening years– 12 out of 3127.
Arkansas was a notable backslider, going from a whopping 2 Black board members in 2016 to 0 as of 2021.
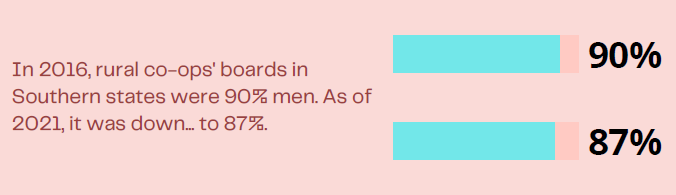
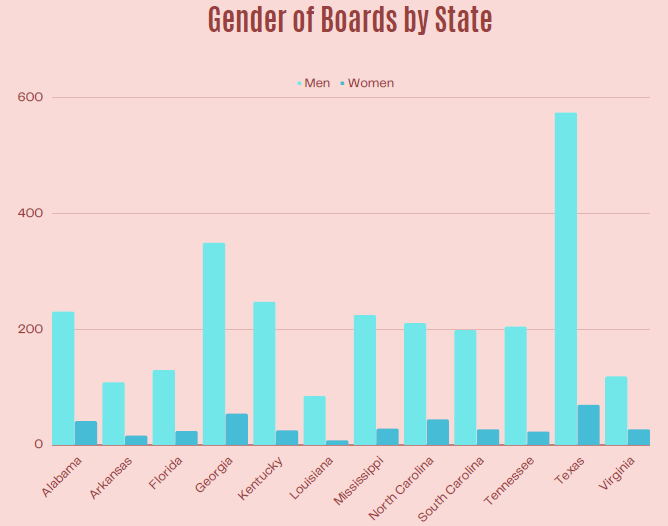
…And Overwhelmingly Male
No state’s co-ops broke the 20% mark for the portion of women on boards. Virginia was highest, with women taking 18.6% of board seats. Louisiana came out worst on this count–only 8.7% of its board members are women.
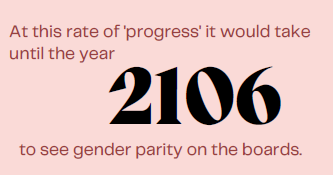
These figures reflect “progress” since our 2016 study–every Southern state inched forward slightly–but it is progress at a positively glacial pace. It’s a rate of change that would take until the year 2106 for gender parity to be achieved.
Alabama
The percentage of women on boards in Alabama went up from 10.9% to 15.1% (from 27 to 41), while the percentage of Black members increased from 4.5% to 9.4% (from 7 to 15). This, in a state whose population is 51.7% female and 26.8% African-American. Several co-ops serve areas with even higher levels of racial diversity, but that is not reflected in their leadership.
For instance, Pioneer took down its pictures after we spotlighted them in our last report. It serves counties (Butler, Dallas, Lowndes, Wilcox, Autauga, Conecuh, Crenshaw, Covington, and Monroe) that together have a 38% Black population, but as of our last report only 1 of 9 board members were Black. Black Warrior has begun publicly displaying its Board members, which they had not done in 2016. The co-op serves counties (Tuscaloosa, Greene, Hale, Dallas, Sumter, Choctaw, Washington, Clarke, Wilcox, Perry, and Marengo) whose population is 42% Black. Yet just 2 out of 9 Black Warrior board members are Black. There is only 1 woman on Black Warrior’s board.
14 of the 22 Alabama co-operatives we surveyed made their elected board’s identities available to the public. Like Pioneer, PowerSouth also stopped displaying its board members after our previous report. PowerSouth’s decision to do so is notable given that its CEO, Gary Smith, writes a highly partisan column in each member newsletter that prominently features his face.
Arkansas
Arkansas’s boards became less transparent since our last study, with only 9 rather than 11 of the 17 making their boards’ identities plain. There were two more women on boards across the state–16 total out of the 136 we identified despite Arkansas being 50.9% female. Additionally, there were no Black board members in any of the co-ops with publicly available information. In our previous study there were 2. South Central Arkansas Electric cooperative went from having one Black member to none. This makes Arkansas’s co-op boards the only set in the South that are 100% white. By contrast, the state’s population as a whole is 15.7% Black and 7.8% Hispanic.
Florida
All the cooperatives we surveyed in Florida have publicly available information about their boards’ identities. The addition of 6 more women to Florida’s boards brought their share of representation up from 11.4% to 15.7% in a state where women make up 51.1% of the population. However, there was no change in the number of Black directors or trustees (3), and the single Hispanic board member was no longer serving, making Florida’s boards 98% white.
Although Suwannee Valley Electric Cooperative serves an area with a Black population of approximately 20%, its board is entirely white.
Georgia
30 of 42 (71.4%) of Georgia’s co-ops had public information available. Georgia is 51.4% female, but only 13.4% (54) of Georgia’s board members are women. That’s up from 9.1% in 2016. The number of Black board members increased from 9 to 14 (5.6% of board members). Georgia is 32.6% Black.
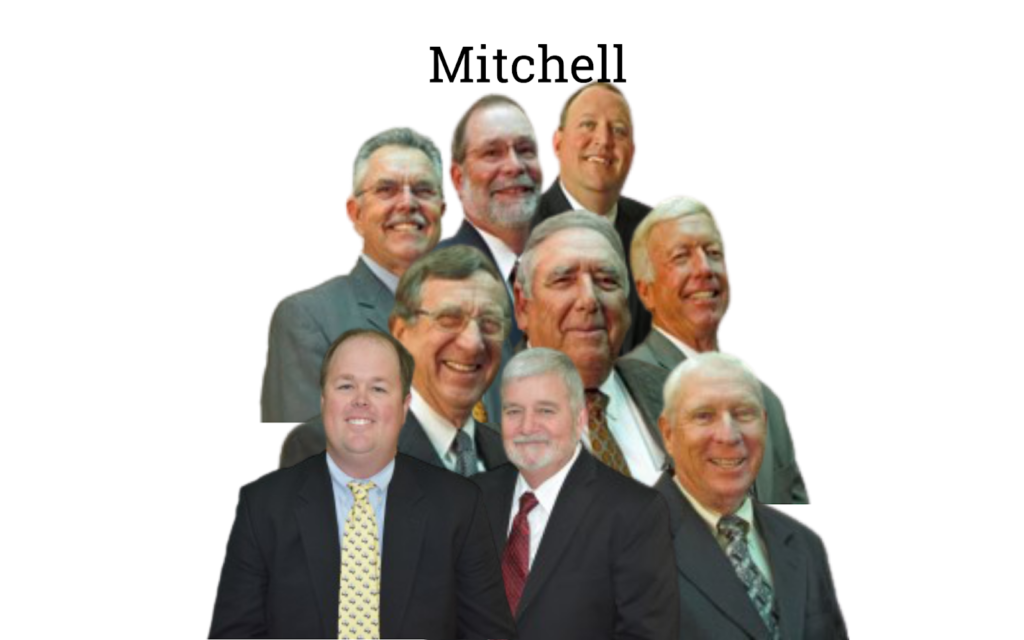
Mitchell EMC, whose service area is evenly divided between Black and white residents, continues to maintain an all-white, all-male board.
Kentucky
We accessed public information about 81.5% of Kentucky’s boards. The addition of 4 women (25 total) brought their share of representation up to 9.2%, well short of the statewide percentage of women–50.7%. There are now 3 Black board members, up from 1 (1.3% of the total). Kentucky, the least racially diverse state in the South, is still 8.5% Black and 3.9% Hispanic. Clark Energy’s board remains all-white and all-male, as they were at the time of our previous study.
Louisiana
In Louisiana, only 6 out of 10 of the cooperatives we surveyed were transparent about their boards. The number of women on the state’s boards increased from 6 to 8 (8.7%) and the number of Black members doubled–from 1 to 2 (3%). Meanwhile, Louisiana’s population is 51.2% female, 32.8% Black, and 5.3% Hispanic.
Washington-St. Tammany went from being an all-white board to having one Black member, Olander Smith.
Mississippi
Only 30.6% of cooperatives in Mississippi had the identity of their boards publicly available on their websites, making it the least transparent state in the South. Overall, Mississippi’s co-ops are less transparent than the time of our previous study. The addition of 9 women across the state boosted the percentage of women on boards from 7.3% to 11.1%, while women make up 51.5% of Mississippi’s population. There are 8 Black board members, up from 2, making for a 7.9% representation rate for a state that is 37.8% Black. To proportionally reflect the state’s population, 98 of board members would be Black.
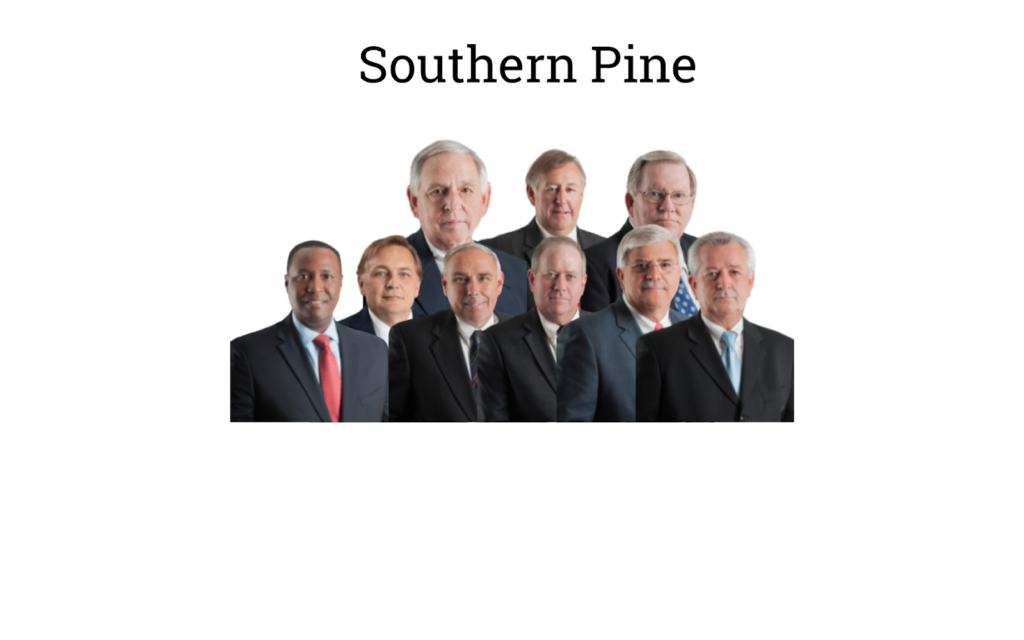
Southern Pine Cooperative continues to have one Black member on its board, as it did at the time of our last report.
North Carolina
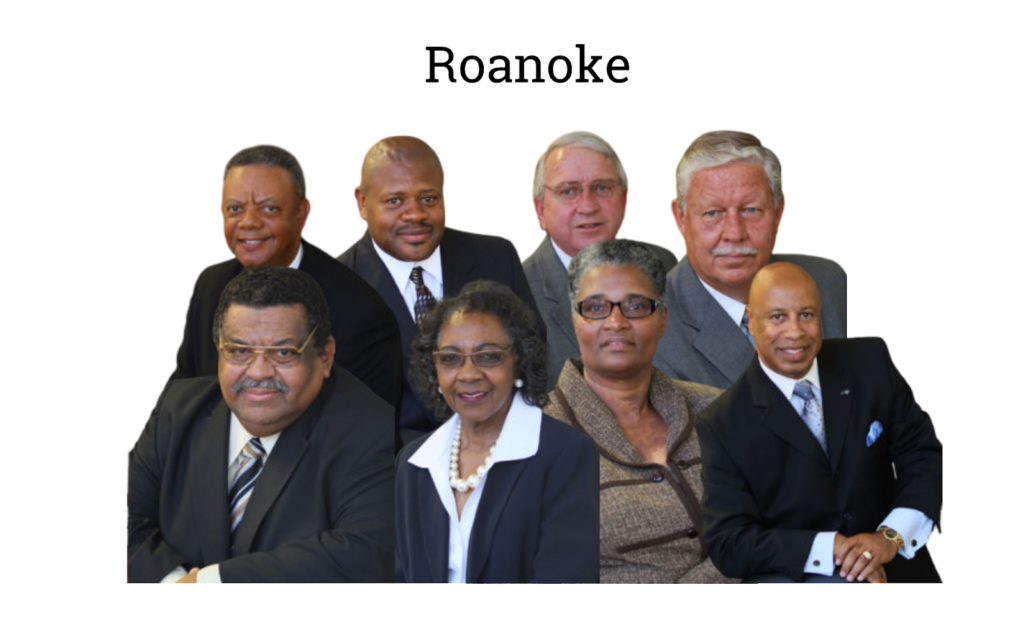
As a state, North Carolina is 51.4% female, 22.2% Black, and 9.8% Hispanic. North Carolina’s boards, of course, fall short of representing those demographics, but they have the second highest percentage of women (17.3%) and the highest amount of Black representation (15.5%) in the South. This is despite North Carolina ranking seventh among southern states in its proportion of Black residents. Additionally, North Carolina has one of only three majority-Black boards in the entire set we surveyed, Roanoke Electric Cooperative. However, no board members were Hispanic. 22 of 26 North Carolina’s cooperatives are transparent about their boards.
South Carolina
South Carolina is on the more transparent side–19 of 22 (82.6%) have their boards pictured online. South Carolina has two majority Black boards–Berkeley Electric and Tri-County Electric. 12% of board members in South Carolina are women, up 2 from 10.7% at the time of our last report but very far from the state population’s 51.6%. There were 6 additional Black members elected to South Carolina boards, bringing Black representation up to 16%, the highest in the South. The state of South Carolina’s population is 27% Black.
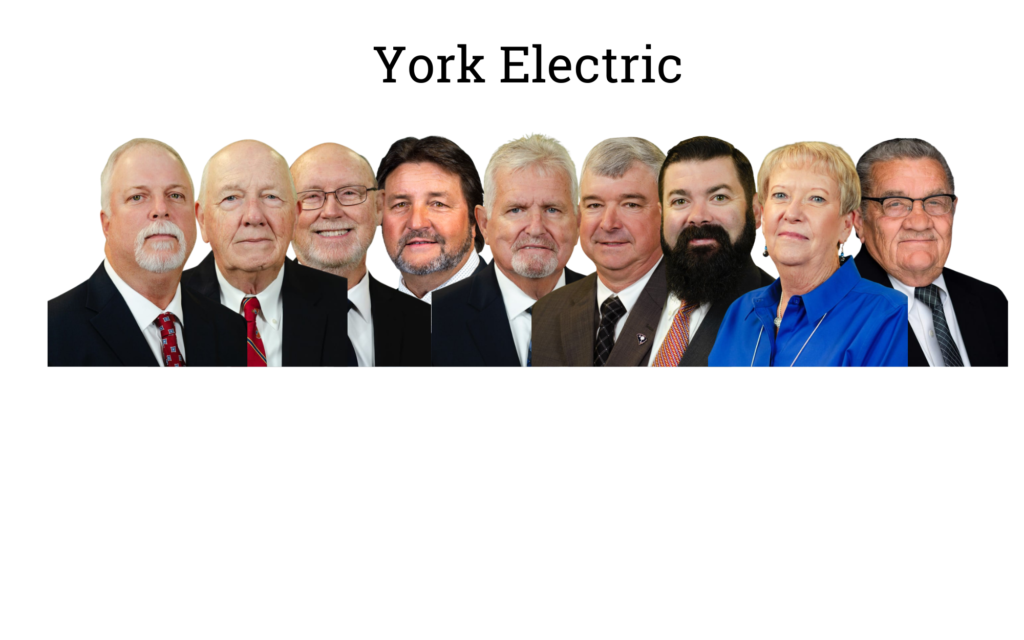
York Electric continues to have an all-white board with one woman, as in 2016.
Tennessee
17 of the 26 co-ops in Tennessee post their boards’ identities. In 2016, women constituted 7.8% of board members–it’s now up to 10.1% (26). Still a long way to go to match the state’s population, which is 51.2% female. The number of Black board members increased from 2 to 6, bringing Black representation up from 1.6% to 3.5%.
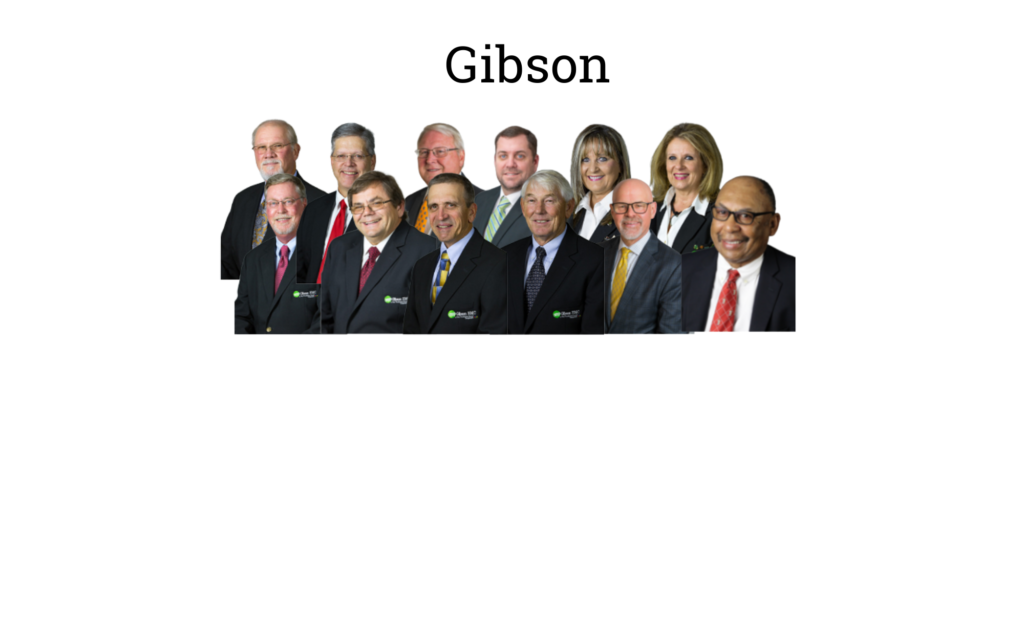
Gibson Electric now has a Black member on its board, whereas in 2016 the board was all white.
Texas
50 of 74 (67.6%) of Texas cooperatives post their boards’ photographs online. Of board members surveyed, 89.3% were men–down ever so slightly from the 90.4% rate of our last study. 10.7% women is, of course, not close to 50.3%, the percentage of women in Texas’s population.
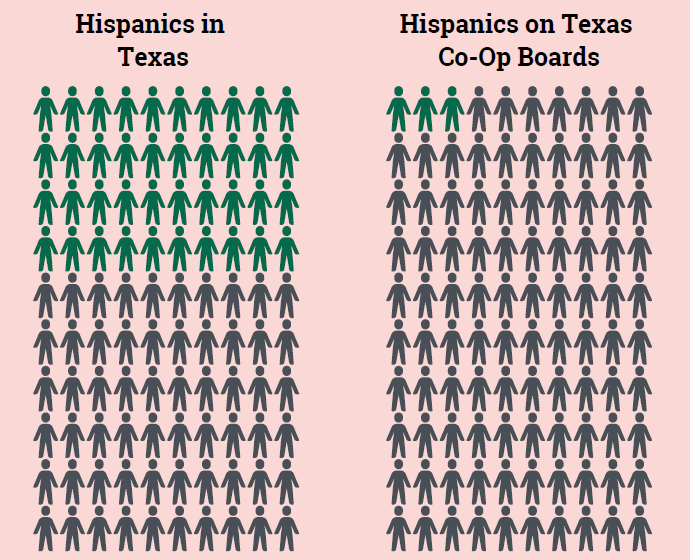
Texas’ boards have just 2.2% Black membership and 2.7% Hispanic membership–which has the dismal distinction of being the highest rate of Hispanic representation in the South. The state as a whole, by contrast, has a population that is 12.9% Black and 39.7% Hispanic.
Magic Valley is the only majority Hispanic board we identified, although it hardly reflects the ethnic diversity within the Hispanic community.
Virginia
18.6% of board members are women, the highest level of gender parity in the South and still nowhere close to the 50.8% of Virginians who are women. Virginia’s 14 Black board members make up 10.7% of the boards, slightly higher than the 9.8% we reported in 2016. Virginia is the second most transparent state in the south, with 93.8% of co-operatives making their elected boards known to their memberships.
Mecklenburg’s board has the same demographics as the last time we surveyed it–7 white men and 2 Black women.
Acknowledgments
A team of dedicated researchers helped make this report possible: Ryann Cohen, Daniel Spivak, Naomy Thibault, Meagan Lee, Kiana Landry, Martin Meng, Trey Gray, Emily Thompson, Julia Stern, Khayin Maheia, and Orion Howard.
David Thompson is research coordinator for the family of organizations that assembled this report, ACORN International, Labor Neighbor Research & Training Center, and Local 100 United Labor Unions. The full report and the data set is available at www.ruralpowerproject.org and the websites of the partner organizations.
Questions on the report or more information can be obtained by email from David Thompson research@chieforganizer.org or from Wade Rathke chieforganizer@acorninternational.org who wrote the 2016 report, initiated the 2021 update report, and assisted on this report.
If you are a member of a rural electric cooperative and want to take action for change in governance and climate policy, contact chieforganizer@acorninternational.org1 https://ruralpowerproject.org/wp-content/uploads/2016/02/Rural-Power___Final.pdf
It’s not just individual patients who are in the dark… Employers are in the dark. Governments are in the dark. It’s just astonishing how deeply ignorant we are about these prices.Martin Gaynor
Summary
A year after its implementation, the government’s price transparency regulation is failing. The government requirement that hospitals begin disclosing their prices is not helping patients. With no meaningful penalties for non-compliance, and no standardization as part of the regulation, hospitals are reporting the prices in wildly different ways, if at all. Moreover, the industry preference for consumer price tools are woefully inadequate even when they “work,” as hospitals do not report estimates within any kind of reasonable range.
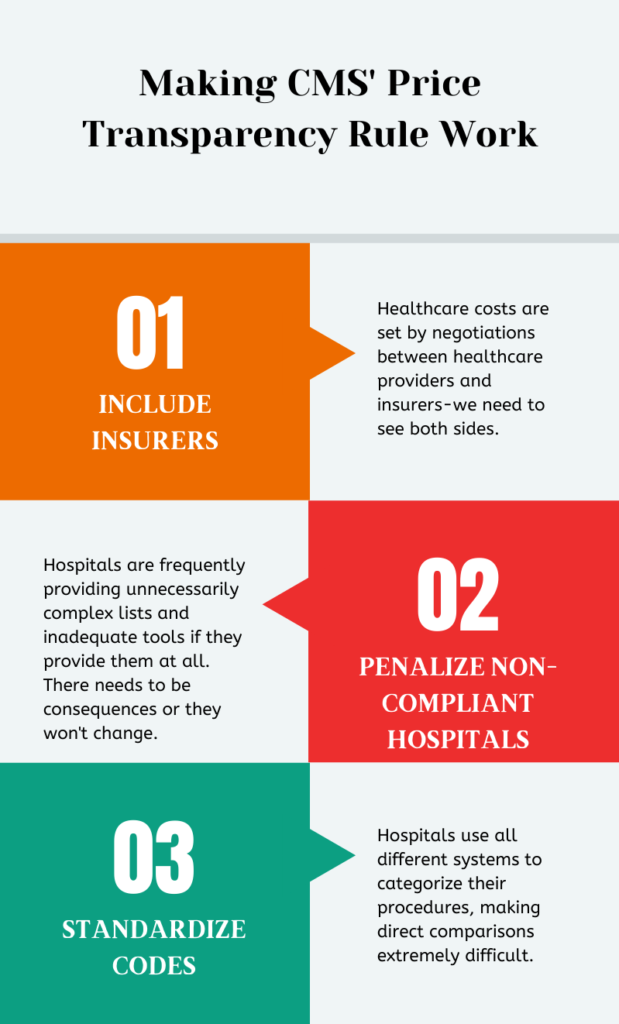
The government and hospitals could both improve it. Health prices are complex because of unique features of our market-based healthcare system, but the price transparency regulation would be significantly improved with three key changes: requiring insurers to begin disclosing reimbursement data, instituting significant penalties for hospitals and insurers who fail to comply, and requiring both a set coding system and plain language descriptions of procedures.
Patients are still in the dark about their estimated costs. Transparency on procedure costs for patients remains low. A minority of hospitals in Arkansas (33%), Louisiana (42%), and Texas (30%) have truly accessible price estimation tools. And among those that do have accessible tools, the range of the estimates can vary so widely as to make them useless.
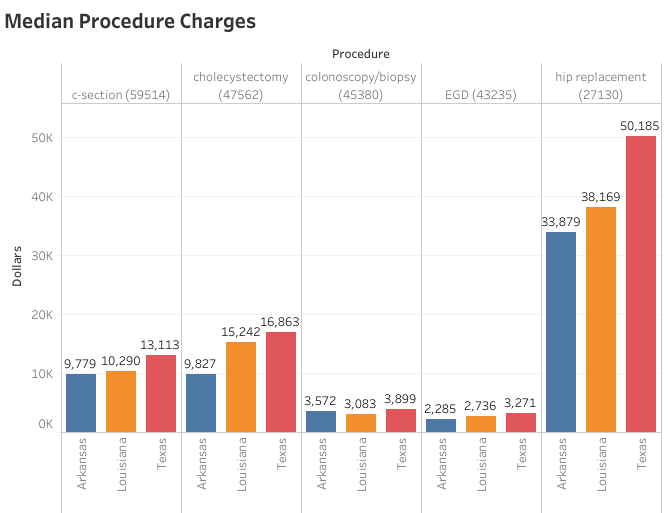
Charges hospitals set are all over the place. There is massive variation in the charges set for procedures between and within all groupings of hospitals.
For-profit hospitals set their charges higher than non-profits and government hospitals in Texas and Arkansas, but in Louisiana non-profits’ charges are much closer to for-profits.
Texas hospitals set the highest charges of the three states, followed by Louisiana and then Arkansas.
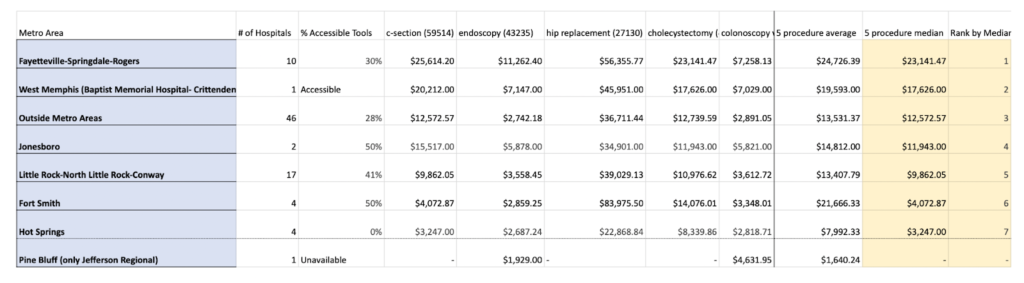
The metro areas with the highest list prices in each state are Fayetteville-Springdale-Rogers (Arkansas), Lake Charles (Louisiana), and Longview (Texas).
ACORN stands ready to help researchers and patients in these three states get better understandings of the costs of care.
It’s so convoluted right now that … nobody can do a comparison across hospitals because every hospital is reporting differently. –Anonymous health industry executive
Introduction
As of January 1, 2021, the Centers for Medicare and Medicaid Services (CMS) began requiring most American hospitals disclose information about the prices of their services on their websites. Hospitals have since produced an ocean of new data to comply with this rule. In Texas, Arkansas, and Louisiana, where we studied this data, we found it to be incomplete, totally lacking in uniform standards, and riddled with inaccuracies. Varieties in hospitals’ methods for setting charges, and varieties in how they report those charges, mean that apples to apples comparisons are difficult. Nevertheless, given the dearth of studies seeking to use this new information to draw conclusions about trends in healthcare, we endeavored to wade through it and report our findings. While apple to apple comparisons might not be possible given the current landscape, we believe we have identified real trends at the “bushel” level. Indeed, we hope that our study will help prompt government and/or industry action to produce new and more uniform information–information that is actually useful to the patients they serve.
Our study of hospitals’ data in Texas, Arkansas, and Louisiana, shows that the price transparency regulation falls far short of its stated goal of shedding light on healthcare costs for the following key, rectifiable reasons:
The regulation is inadequate in scope: Healthcare costs are not determined by providers alone, but via a process of negotiation between healthcare providers and payers–private and public (Medicare and Medicaid) insurances. Because the regulation does not require insurers to disclose information about their side of the deal, we are only seeing one side of the information we’d need to make reliable and specific estimates about the actual cost of care for patients.
The regulation carries no significant penalties for noncompliance: Hospitals are frequently failing to comply in good faith with the spirit of the regulation–providing unnecessarily complex lists and inadequate tools if they provide them at all. The rare exceptions to this trend show us that good faith compliance is, in fact, attainable.
The regulation itself fails to set standardized requirements for reporting, making direct and meaningful comparisons between hospitals inordinately difficult. The government’s failure to require the use of a standard coding system for procedures or require plain language descriptions of procedures has allowed this area to be yet another free-for-all in the American healthcare system, with as many variations in compliance as there are individual hospitals. The regulation should require plain language and move hospitals toward standardization of coding.
Despite the failings of the regulation, we are confident about certain trends. Overall, there remains a glaring lack of transparency from hospitals. While most have made at least some form of machine-readable price file available, many of those are not compliant with the basic requirements of the regulation. And only a minority have made truly accessible tools that consumers can use to compare prices–33% in Arkansas, 42% in Louisiana, and 30% in Texas. Even when those tools are accessible, the estimates provided often range so widely as to be useless.
Our survey shows that Texas hospitals set the highest charges of all three states, followed by Louisiana and then Arkansas. While non-profit hospitals tend to set lower charges than for-profits in Arkansas and Texas, the same can’t be said for Louisiana. There, the non-profit hospitals’ average charges are close to or greater than for-profits.
We identified metro regions with the highest charges in each state: in Arkansas, Fayetteville-Springdale-Rogers, in Louisiana, Lake Charles, and in Texas, Longview. However, perhaps more relevant is the extent to which costs vary wildly within each metro region.
Despite complaints from the hospital industry about the administrative cost of complying with the regulation, we did not find noticeable trends correlating hospitals’ revenue with compliance. In other words, we find no evidence that richer hospitals are more inclined or capable of complying than are poorer hospitals.
We found that price comparison tools were only truly accessible at 33% of Arkansas hospitals, 42% of Louisiana’s, and 30% of Texas’s. Of that minority whose tools were accessible, unfortunately, the estimates were often useless.
Background
The government rationale for the price transparency rule is straightforward enough: healthcare costs continue to rise unabated, and requiring healthcare providers to disclose their prices to the public will help to bring down those costs by enabling comparison shopping. Think of it this way: If the only way you could purchase bread was by getting billed after eating it, and everyone got billed different amounts, bakers might be able to set all kinds of high prices for bread. Our ability to see the prices of breads before purchasing the one we want allows us to pick one that’s reasonably priced. The aggregate of those individual decisions (i.e., consumer demand) ought to interact with the aggregate of the bakers’ individual bread-making costs (i.e., supply) such that prices stabilize. Bread’s cost might fluctuate due to disruptions in bakers’ ability to supply it, but at least prices won’t grow year after year just because no one knows the price of the bread until after they eat it.
In other words, hopefully, the idea is that “price transparency” would make health costs more like bread costs.
However, healthcare is different from most goods and services in several fundamental ways.
If healthcare is a commodity because we pay for it, then it is closer to commodities like funerals or repair services after a disaster than goods we buy in a store. The need for healthcare arises universally but unexpectedly, with costs generally beyond an individual’s ability to pay for them. Thus, people began pooling their resources, paying a bit into the pool at regular intervals in exchange for access to that pool in the moment of need–insurance, in other words. Prices, then, are not set so much by the relationship between the consumer and provider so much as the insurer and the provider. Insurers want to keep prices lower to minimize what they pay; providers want to get prices higher to maximize their profits. At the same time, the fact that services are insured make them more accessible than they would be if they all had to be paid for out of pocket, which pushes demand and prices up.
In the United States, there is additional complexity: multiple insurers that compete with each other to pay multiple providers for healthcare costs. This is in contrast to a socialized healthcare system where the government is the main provider of service, as in the United Kingdom, or a single payer system where government insurance pays the costs to multiple providers, as in Canada. If everyone was in one insurance pool, the administrators of that pool would have more leverage with providers to keep prices lower. Consider that most hospitals simply cannot afford to turn down Medicare and Medicaid patients because there are just so many of them. The flip side is that hospitals have to then accept the government’s set rate of reimbursement and comply with CMS regulations, such as the price transparency rule. Recall private insurance companies’ fears during the Obamacare debate that a “public option” would end up out-competing private insurance, due in part to its ability to leverage a potentially massive pool of insured people.
The complexity of endless negotiations between insurers and providers produces inefficiencies. Consider just one of the many Russian nesting dolls of problems unique to our system:
[I]n efforts to negotiate better prices, insurers must be able to “threaten” to (and often do) exclude some clinicians or health care centers from their network. As a result, administrative dollars are spent to help find in-network clinicians or health care centers or steer patients to the lower-priced clinicians or health care centers in the network. Several industries have emerged to manage network and benefit complexity (e.g., firms that support patients as they navigate their network and their benefit design, as well as firms that support employers in designing benefits and choosing insurers). The associated administrative costs are spread across payers, clinicians and health care centers, employers, and even patients.1
Little wonder that administrative costs make up an estimated 34% of American healthcare costs, as opposed to 17% of Canada’s2. In fact, the number of jobs supplied by the healthcare administration is itself a significant political barrier to efforts to reform and simplify healthcare delivery. The ballooning cost of healthcare is a long-term problem, but politicians are loath to make reforms that would lead to immediate job losses in its administration3.
The upshot is, healthcare prices are extremely complex and varied not just because they aren’t transparent, but due to the basic market set-up of our healthcare system.
The price transparency rule aims to start shining a light on this complexity–a flashlight lighting up thick layers of cobwebs. The rule itself has two main parts. One, hospitals have to provide systematic lists of all their prices in formats that can be processed by a computer (“machine readable files”). Hospitals often refer to this list as a “chargemaster” or list of standard prices. Two, they have to provide a “consumer friendly” list of the kind of common procedures a person could theoretically shop for in advance (“shoppable services”). But a hospital doesn’t set just one price for each procedure. It negotiates a different price with each individual insurer and sets another price for people paying directly without insurance (the “cash discount” or “self-pay” rate). All of this is separate from the rates government insurance pays hospitals for a procedure.
So, the CMS regulation requires hospitals to publish the following four prices for each procedure in their systematic lists:
What the hospital sets as its initial “charge,” list price, or gross cost. Think of this more as the hospitals’ starting point for their negotiations with insurers.
The highest rate the hospital has negotiated with a given insurer for a given procedure. They don’t have to identify which insurer this is (thus, a “de-identified maximum”).
The lowest rate the hospital has negotiated with an insurer (“de-identified minimum”) for a procedure.
The ‘cash discount’ price hospitals charge people without insurance or people who ‘self-pay’.
For instance, Texas’s Good Shepherd Medical, Longview, is compliant with this part of the regulation and lists the following prices for hernia repair:
gross: $42,608.45
min negotiated: $2,650.54
payer specific negotiated: $10,450.28
maximum negotiated: $10,450.28
cash price: $19,173.80
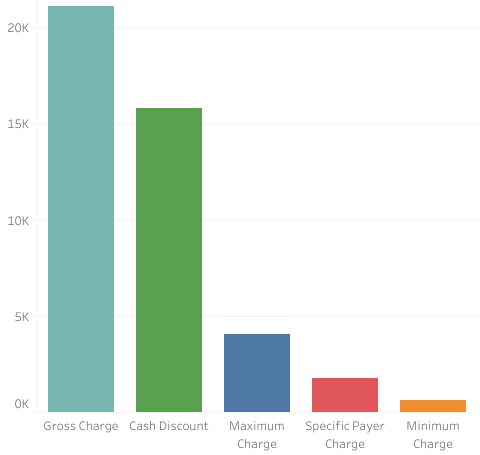
The listing of prices for an endoscopy at Texas’s Baptist Medical Center (San Antonio) provides a striking visual example of how much these different prices for the very same procedure can vary. The minimum negotiated price the hospital negotiated with an insurer for an endoscopy is $614.51, the maximum is $4069.19, the cash discount (what an uninsured person would get billed) is $15,820.51, and the gross charge is $21,094.01. Once all the additional costs and codes are factored in, the cost to the patient/insurer presumably lies somewhere in this range:
This is the kind of range of costs presented by hospitals who are in compliance with the CMS requirements for machine readable files. But the level of compliance with this requirement ranges widely, with as many permutations of price reports as there are hospitals. Many hospitals have elected to publish only one price for each procedure in their machine-readable file–the list, or “standard,” price. Others publish far more, with vast spreadsheets or text blocks noting the price paid by each insurer for each medical variation of the same procedure.4
Indeed, there is no uniformity around how a medical procedure should be listed, or how many variations of it are permissible to include in the listing. Does the cesarean section include sterilization, complications, comorbidities? Is the appendix removed with a laparoscope or open incision? Is the hip replacement due to hip fracture or not? All these factors might, or crucially, might not, affect how a hospital sets or reports its rates. Sometimes the procedures are systematized by one of the several insurance billing code systems, other times they are not. Some hospitals will tell you the rates for a dozen different varieties of endoscopies, others only one. A text search of Raceland, Louisiana’s Ochsner’s St. Anne’s chargemaster for “appendectomy” produces 289 results, for instance–with separate entries for each insurer and variety. A few hospitals even separate out various components and materials of charges which one would need to add up to get to a full rate.
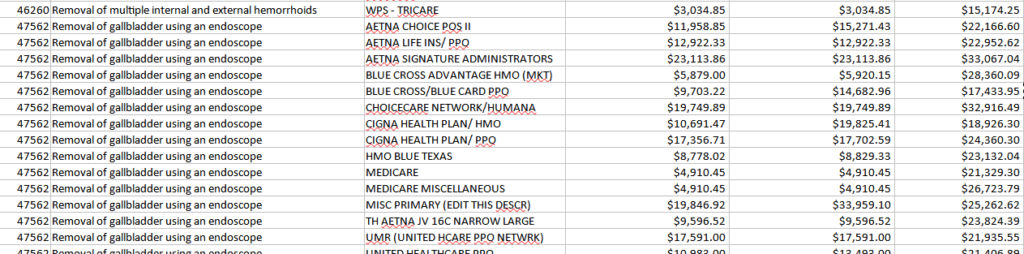
Consider the rich variety of prices listed by USMD Arlington, in Texas, for a specific billing code of a cholecystectomy (gallbladder removal). They are delineated by insurance plan type:
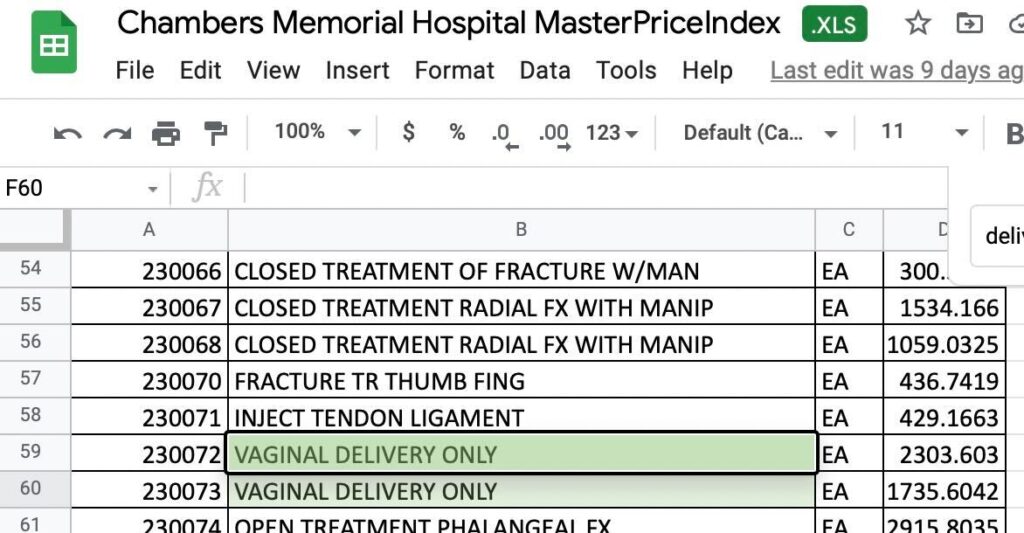
Often, however, the reason for a different coding of a procedure, which leads to a different price, was not explained, as in the case of Danville, Arkansas’s Chambers Memorial Hospital:
Part of this particular issue is related to yet another specifically American quirk of complexity: the ever-growing, ever more lucrative systems of medical coding that have reached dizzying levels of intricacy5:
[T]he complex system of billing and coding that underlies bills…with its lines of alphanumeric codes and arcane medical abbreviations, has given birth to a gigantic new industry of consultants, armies of back-room experts whom medical providers and insurance companies deploy against each other in an endless war over which medical procedures were undertaken and how much to pay for them… Toward the end of the 20th century and into the next, as strategic coding increased, a new industry thrived. For-profit colleges offered medical-coding degrees, and internships soon followed. Because alphanumeric coding languages are as distinct from one another as Chinese is from Russian, different degree tracks are necessary, along with distinct professional organizations that offer their own particular professional exams, certifications and licensing. Hospital systems and insurers — which have become huge, Hydra-like enterprises — now all employ roomfuls of coding-program graduates to perform these tasks. Membership in the American Academy of Professional Coders has risen to more than 170,000 today from roughly 70,000 in 2008.
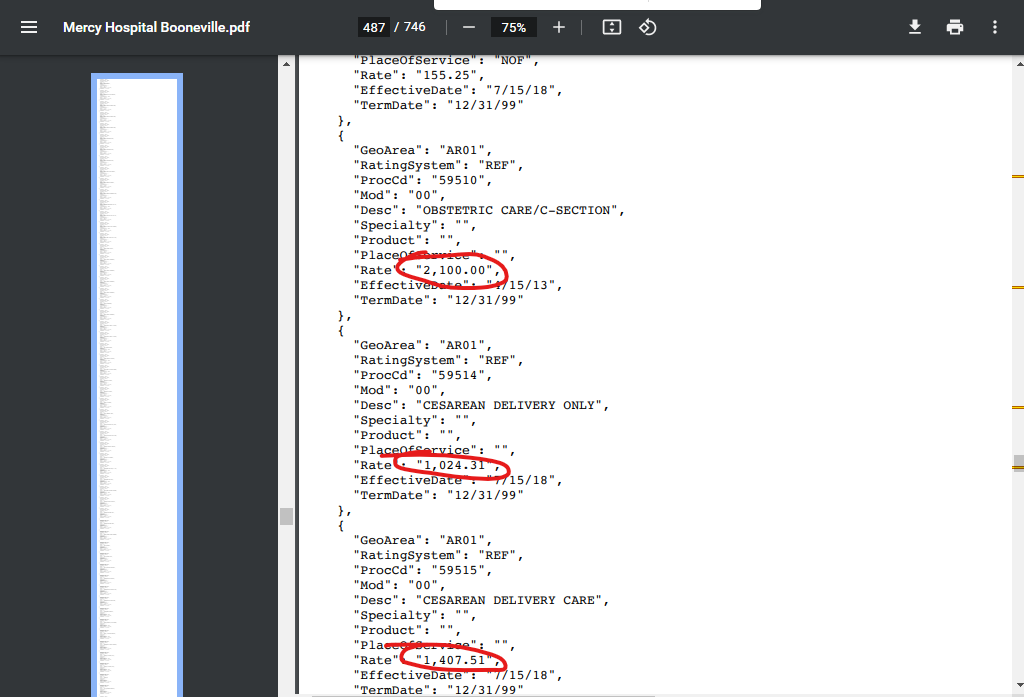
Consider a usage of the most common coding system, the American Medical Association’s proprietary Current Procedural Terminology (CPT®) system, at Mercy Hospital Boonville in Arkansas. It delineates separate or different charges for “obstetric care/c-section” (code 59510, $2,100), “cesarean delivery only” (code 59514, $1,024.31), and “cesarean delivery care” (code 59515, $1,407.51):
So, the coding systems used by different hospitals are themselves complex. But worse, from the point of view of the consumer’s understanding, hospitals weren’t even required to use a coding system in their published chargemaster or to make it clear what each procedure is. Right now, as noted by a government guide to compliance prepared for hospitals, “there is no requirement for the description in your machine-readable file to be in plain language; you may consider using the short description associated with corresponding billing codes, or the short description used in your hospital’s chargemaster, or another type of description.”6
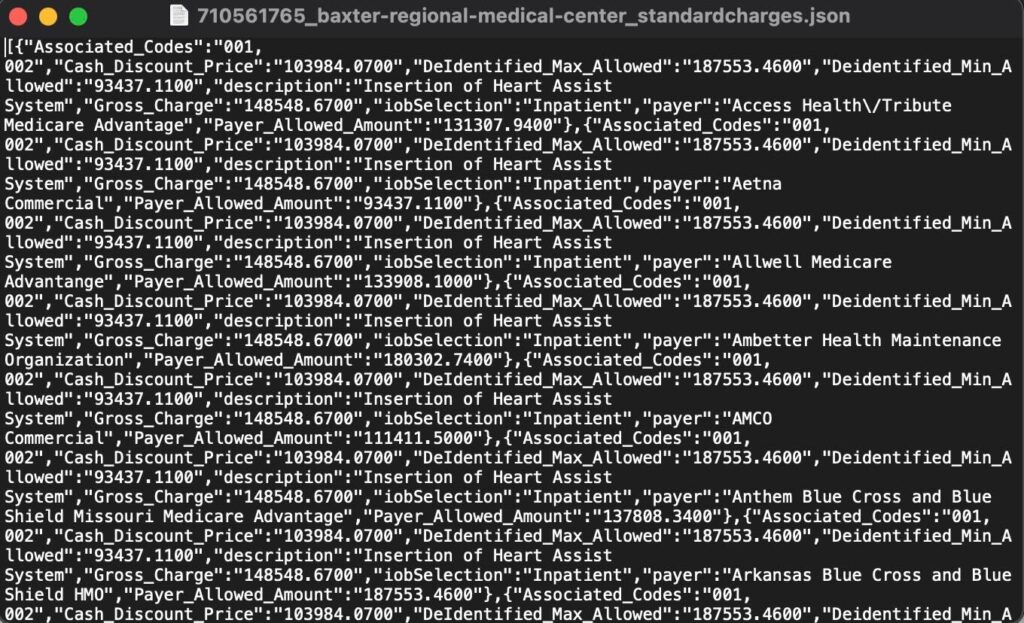
Additionally, while many hospitals provided a machine-readable file in familiar file formats–Excel spreadsheets or pdf files–many elected to provide the data in a programmer specific format known as “json” files. Here’s an example of what one such file from Baxter Regional Medical Center, in Mountain Home, Arkansas, looks like:
On the way to finding these files on their websites, many hospitals make a patient or investigator wade through paragraphs of dense legal text that argue that their standard prices have little useful information. In Louisiana, a number of hospitals had copy-pasted the same block of text that appeared to be drafted by the Mississippi Hospital Association, the organization behind a linked video that “explained” price transparency.7 The video trashes the CMS rule and speciously explains away the variability of healthcare costs as being akin to airline tickets, as if the prices simply varied due to fluctuations in supply and demand. The thrust of the text is always similar: this document is pointless, it will not tell you how much you are likely to have to pay, don’t hold us to these numbers because it’s very likely you will end up having to pay more. We kept these admonishments in mind for our methodology and whenever possible, used the highest quoted price in our comparisons.
Frequently, the hospital’s disclaimer text would encourage the reader to try out the hospitals’ preferred method of “transparency:” a separate website portal where you put in your name, insurance, and type of procedure, and you get an estimate for that procedure’s cost back. CMS has allowed hospitals to use these tools in lieu of publishing a “consumer friendly” list of “shoppable services” — the second main part of the regulation. According to the above quoted hospital executive, “Providing patients with estimates, I think that’ll stick. That’s something hospitals will do even without a rule [and] I think we’re already past that issue by and large.”
But as our analysis shows, most hospitals in our three surveyed states either have not made such a tool, require onerous amounts of information to use it, or have a tool that only shows prices for a limited number of services. We found that such tools were only truly accessible–findable and gettable without having to enter your health insurance ID numbers–at 33% of Arkansas hospitals, 42% of Louisiana’s, and 30% of Texas’s.
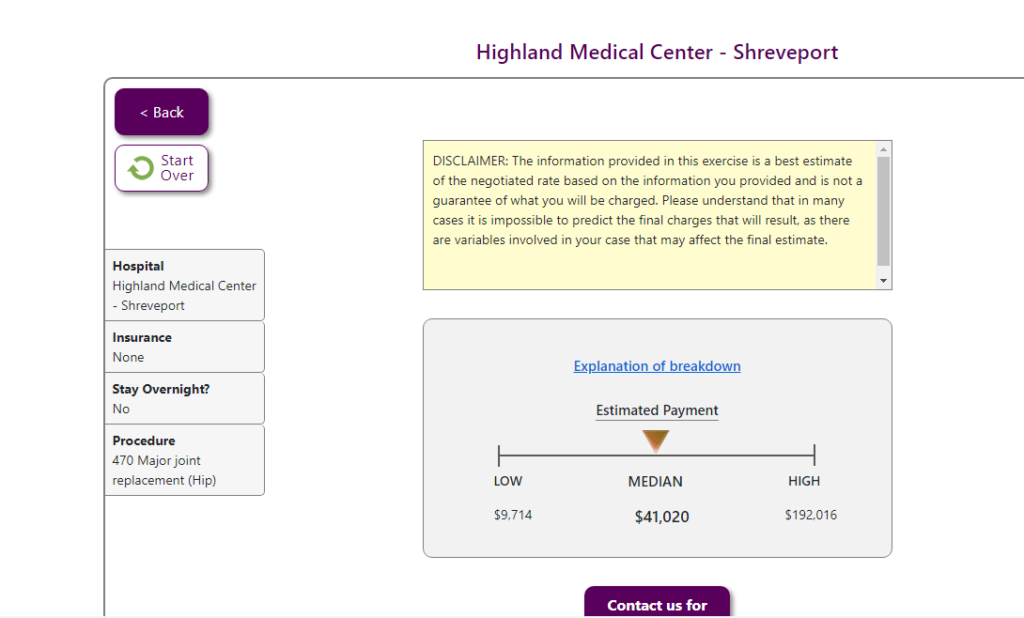
Of that minority whose tools were accessible, unfortunately, the estimates were often useless. This estimate for the cost of a hip replacement at Highland Medical Center, in Shreveport, Louisiana, which has a tool we rated as “Accessible,” ranges from $9,714 to $192,016. That’s a span of $182,302.
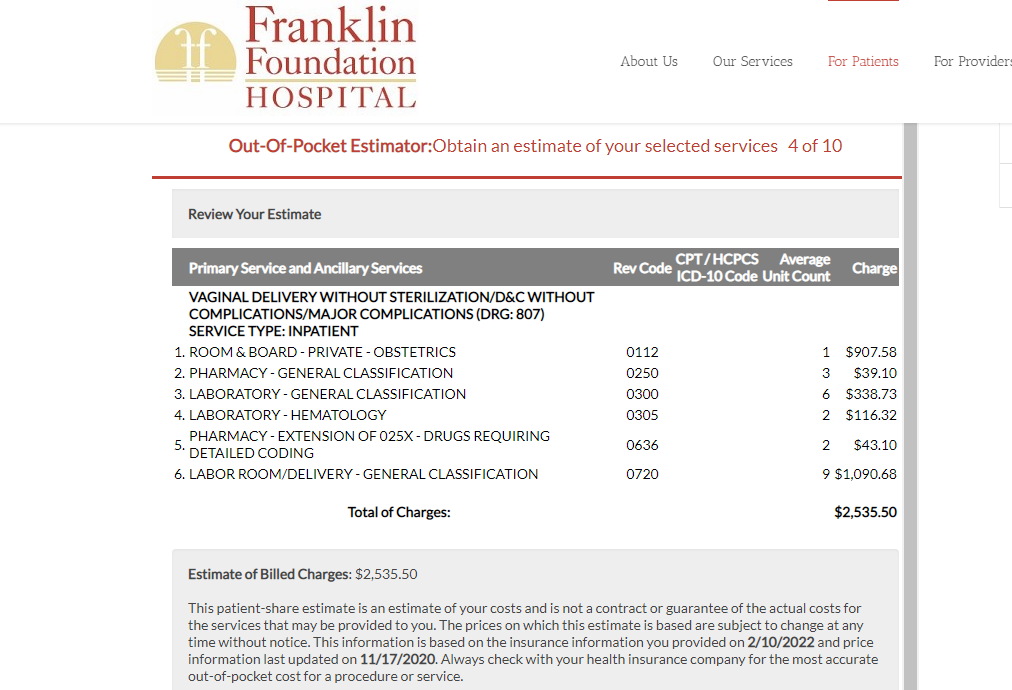
Much rarer was the tool that provided a clear, itemized set of estimates. Franklin, Louisiana’s Franklin Foundation Hospital stood out for its clarity above nearly all the rest:
Methodology
As a New York Times’ investigation of hospital price transparency data put it, “hospital and insurers didn’t want you to see these prices,”8 let alone compare them. Perhaps it’s for this reason that there are studies of the range of costs for procedures9, but fewer comparing the costs between different sets of hospitals.
Nevertheless, we refused to let complexity of the industry’s making deter us from analyzing trends in the industry, even if that complexity makes our measurement tool blunt and imperfect. Greater uniformity in charge reporting, whether undertaken due to industry or government pressure, will lead to greater accuracy.
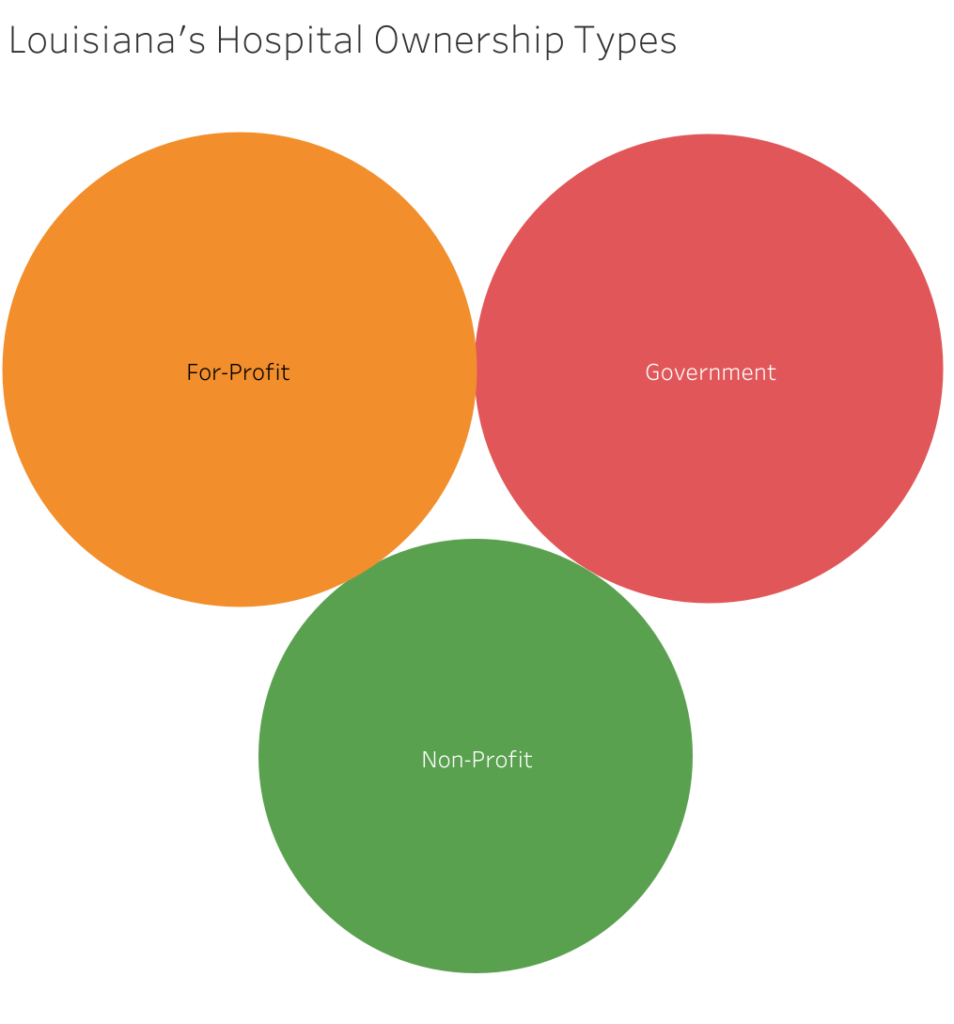
So, we built lists of hospitals in Louisiana, Texas, and Arkansas, starting from state lists provided by the American Hospital Directory. We added additional campuses or sites and removed closed or inactive hospitals as we searched for each hospital’s website. We followed the Directory’s categorizations of these hospitals’ “ownership types” — that is, whether they are owned by a non-profit corporation, a corporation organized to provide returns to shareholders (including physicians), or overseen by a governmental authority. From those lists, we began to track who was compliant with the CMS rule. When they weren’t, we filed complaints with CMS–178 complaints across our three target states10. Then, we went back and located files from newly compliant hospitals and began analyzing all available lists of standard prices in the three states– 86 hospitals in Arkansas (70% now provide some kind of machine-readable file), 121 in Louisiana (77% have a machine-readable file), and 392 in Texas (90%). We have compiled each of these files into a central location and are providing them to the public to expedite additional research and comparison shopping.
From an initial list of 30 common procedures that we collected data for, over time we settled on five that were relatively uncomplicated in their coding, appeared in many hospitals’ data, and which we felt confident could be compared across hospitals: a cesarean section, an upper GI-endoscopy (EGD/esophagogastroduodenoscopy with brush wash), hip replacement (arthroplasty), laparoscopic gallbladder removal (cholecystectomy), and colonoscopy with biopsy. We aimed, whenever possible, to choose the charges for the versions of these procedures without complications.
The array of prices for every procedure at every hospital made arriving at a consistent variable difficult to compare and contrast difficult. Our researchers several times found that after having collected a ream of data on what we felt was reasonable to compare, a new piece of information showed us that it was not. For instance, we ended up not using our appendectomy price lists to make comparisons because we found major price variation between two methods of appendectomy, methods which were sometimes but not always specified by the hospital.
However, we took nearly every hospital’s admonishment that costs could always be higher than the estimate as helpful methodological advice. Whenever the hospital listed only one price–the list/standard/gross charge–we used that. But, for instance, at Christus Shreveport, the gross charges listed by the hospital for a hip/knee replacement are $91,169.90, The hospital managed to fetch a higher rate from at least one insurance company so its “de-identified maximum” for the same procedure is $164,815.60. In this as in other cases, we took the higher of the two prices.
Meanwhile, at Children’s Hospital New Orleans, the price of the same procedure has a gross of $251,182.00 while the de-identified maximum is lower–which is more typical– at $195,921.96. Again, we used the higher of the two listings.
Therefore, while pinpointing the cost of the procedure at either hospital is impossible, it is reasonably certain that it would cost a person more at Children’s Hospital than it would at Christus Shreveport.
For our analysis of the accessibility of the comparison price tools, our team divided them into four different categories: accessible, difficult to access, unavailable, or unreliable.
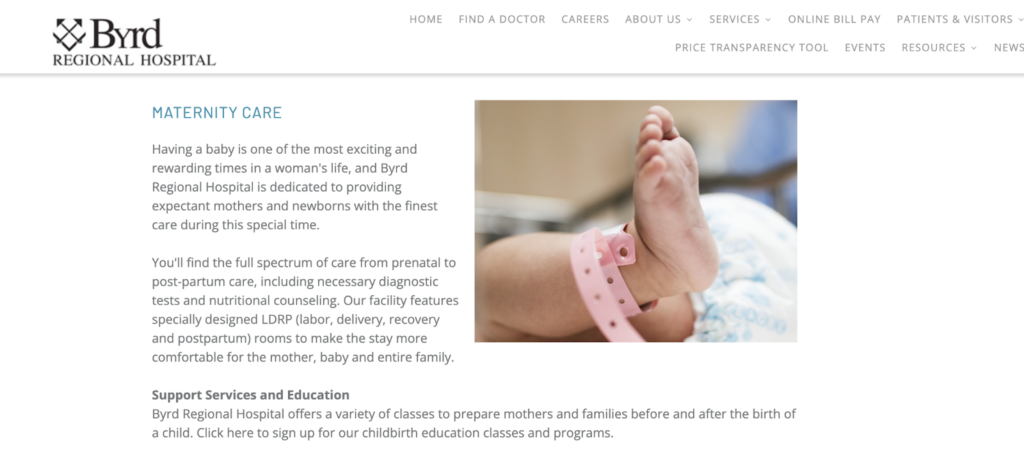
“Unreliable” tools were those that didn’t give us price estimates for procedures we knew were available at the hospital, usually because they were listed in the chargemaster. For instance, Byrd Regional Hospital in Leesville, Louisiana proudly lists its full spectrum of maternity care offerings, but its price comparison tool says the hospital does not provide deliveries.
Here the hospital shows its maternity care…
“Unavailable” meant that we could not locate a comparison tool on the website within a few minutes of searching for one. We categorized a tool as “difficult to access” if it required someone to have their specific insurance member identifications and/or group numbers before receiving an estimate. “Accessible” meant that we could quickly find a procedure, enter an insurance plan, and get an estimate.
Analysis
We found median charges for our test procedures to be highest in Texas, followed by Louisiana, with Arkansas the lowest of the three. The average of medians for Louisiana’s charges was 17.2% higher than Arkansas’s; the average of medians for Texas’s charges was 47.2% higher than Arkansas’s.
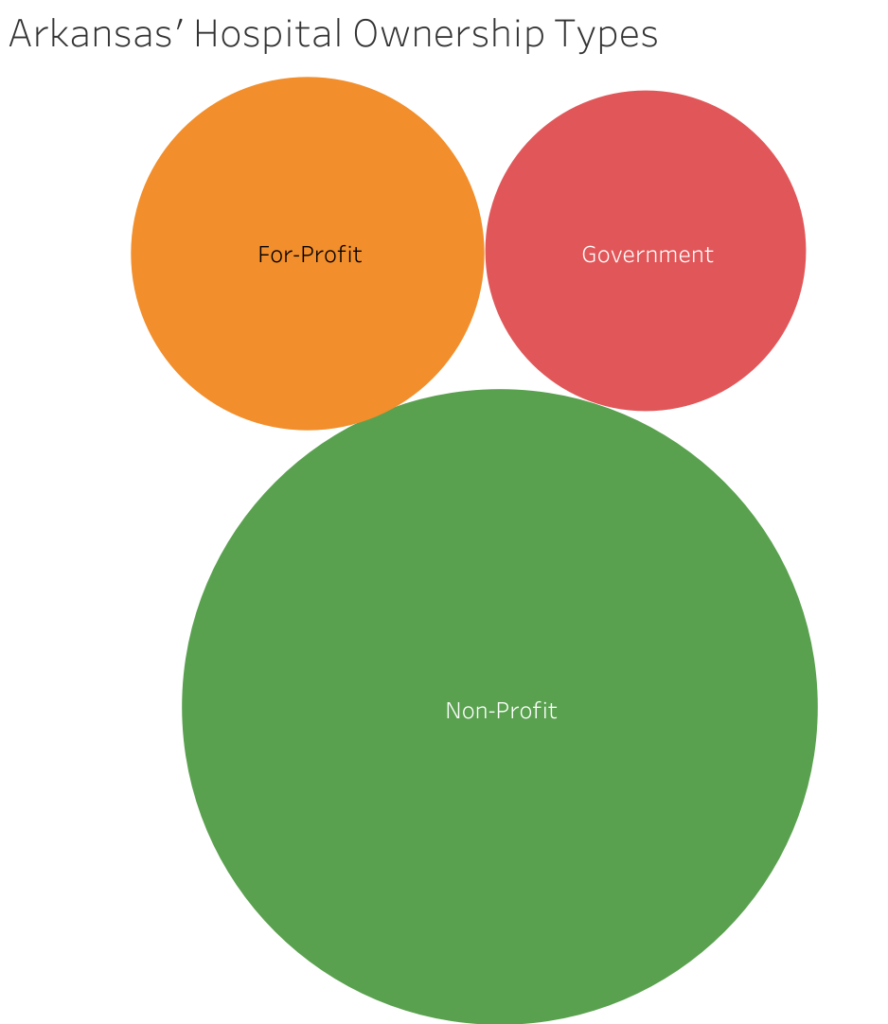
Louisiana had the highest level of transparency and accessibility, followed by Texas and then Arkansas. Government hospitals tended to have lower charges than hospitals run by private corporations in both Louisiana and Texas, but in Arkansas very few government hospitals provided charge information. Arkansas has the highest proportion of non-profit hospitals of the three states.
Arkansas
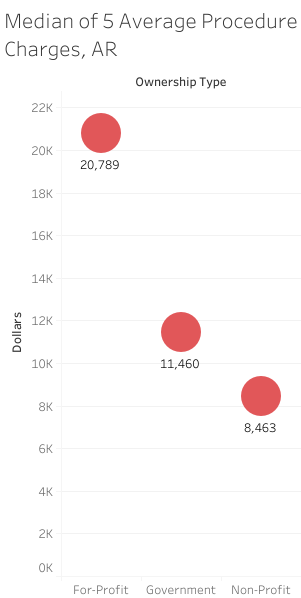
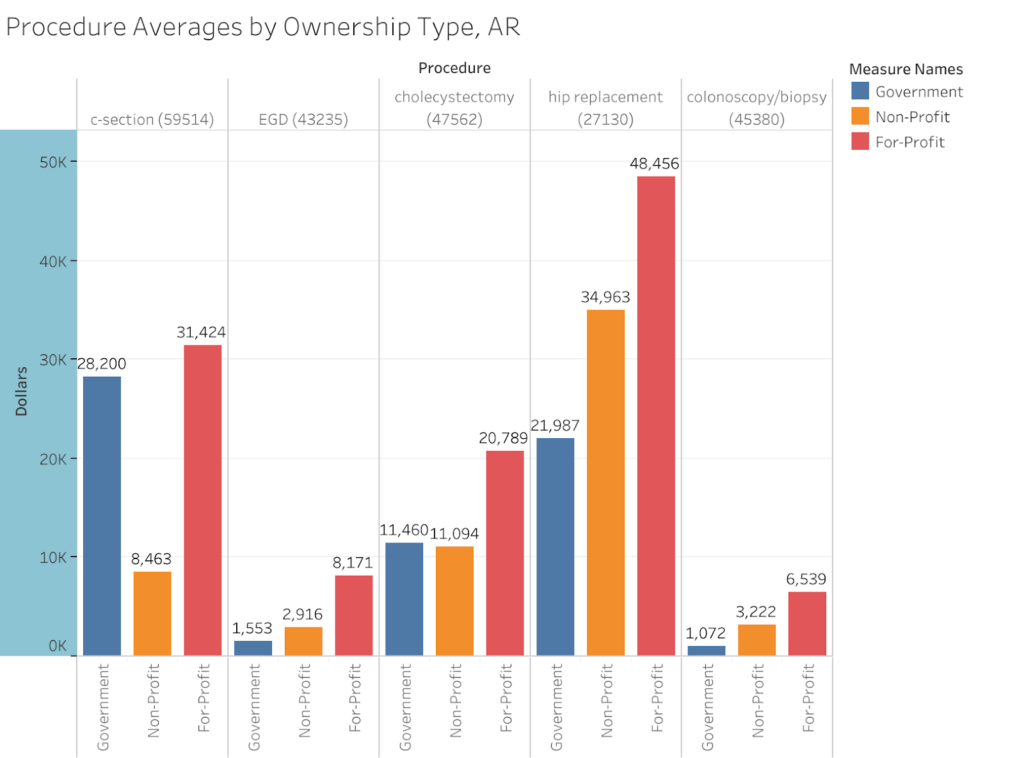
The set of 17 private, for-profit hospitals we surveyed in Arkansas had higher average charges for their procedures than their 55 non-profit and 14 government counterparts. For-profits had the highest average procedure charge for each of the five procedures we surveyed (see below). Government hospitals had higher charges than non-profits for 2 of the 5 procedures, but only 1 of the 14 government hospitals had complete price information, making the “averages” weighted heavily toward the charges set by the University of Arkansas Medical Center (Little Rock)–a government district hospital in the American Hospital Directory’s classification system.
Helena Regional Medical Center was a high-cost outlier in the for-profit pool, reporting extremely high DRG average charges for each procedure, rather than the required set of charges. Thus, the average per case for a hip replacement charge was $115,580, while the average Medicare-insured pocket-cum-insurance payout was $13,785 for that procedure. We reached out to Helena regarding its price transparency but received no response. However, even with Helena Regional removed from the pool, the for-profit average was nearly twice that of non-profits.
Only 7% of government run hospitals had accessible price comparison tools–due in part to the VA’s exemption from the price transparency requirements. 36% of non-profits were accessible, as were 30% of for-profit hospitals.
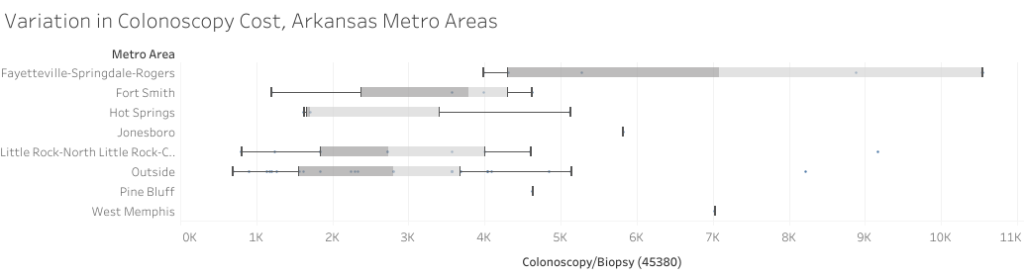
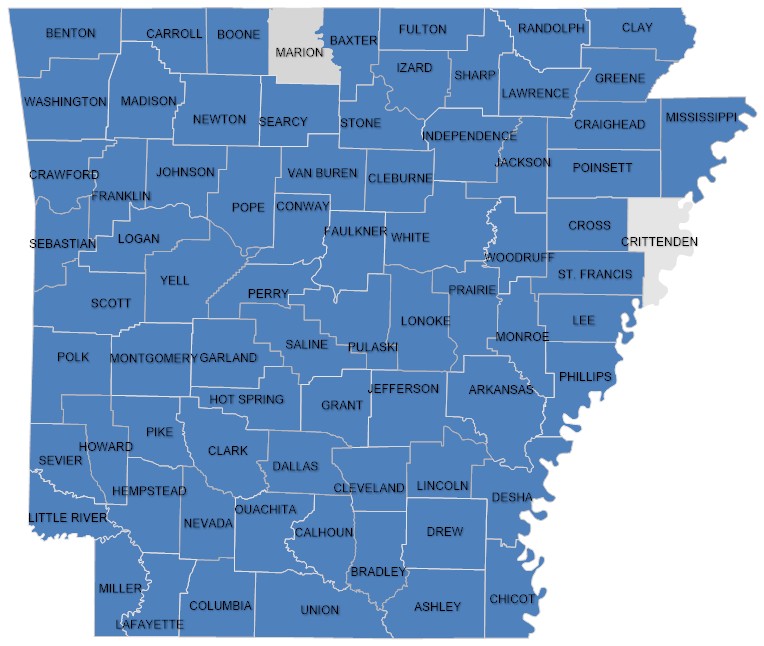
Charges for the same procedures vary widely between but also within all metro areas, as is visually demonstrated by this comparison of colonoscopy charges across Arkansas:
6 of Arkansas’s 17 for profit hospitals are in the Fayetteville-Springdale-Rogers statistical area–the majority of that area’s 10 hospitals– helping to make the metro area the one with the highest list prices in Arkansas.
For instance, Hot Springs’ non-profit St. Vincent Hot Springs has a list price for a colonoscopy with biopsy of $1624. That is lower than any hospital’s list price for that procedure in the Fayetteville area. The lowest list price for a colonoscopy with biopsy there is $3,984, at Mercy Hospital of Northwest Arkansas, another non-profit.
The below table ranks metro areas by the median charge of our 5 surveyed procedures, with all hospitals outside the listed metro areas grouped together as their own set.
Louisiana
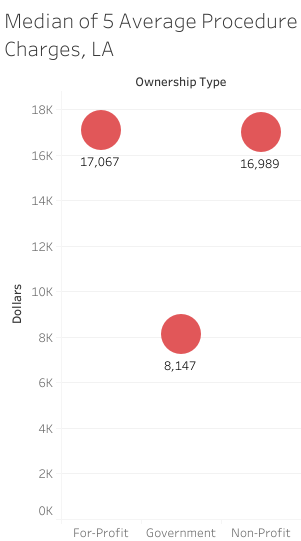
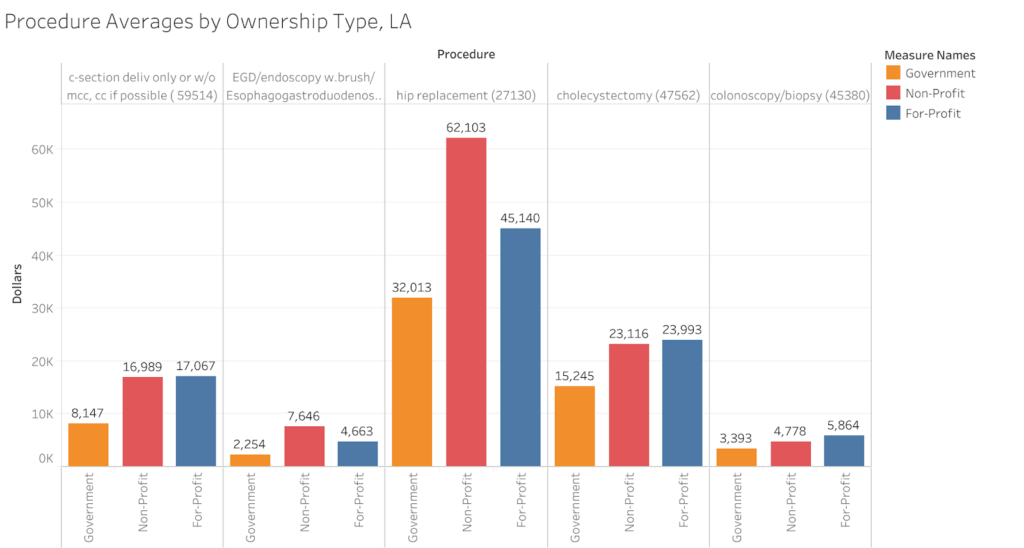
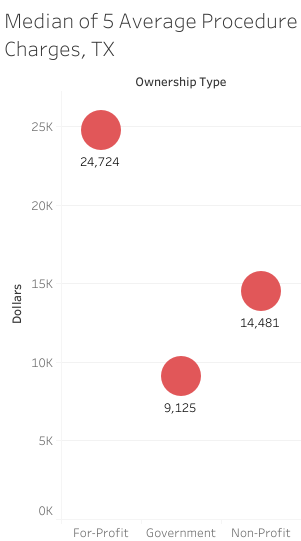
Louisiana’s set of 36 non-profit hospitals had the highest across the board average for our 5 procedures– the state’s 43 for-profits’ average was 16% lower. The 42 government hospitals’ list price average came in 46% lower than that of the non-profits. This appeared to be due to the higher costs for two of our procedures, the hip replacement and endoscopy, in the pool of non-profit hospitals, as non-profits had lower averages for the other three procedures. However, the median of the 5 averages was highest for for-profit hospitals. Whatever way we look at it, non-profits are setting charges closer to for-profits in Louisiana than they do in either Arkansas or Texas.
Government hospitals as a group had the lowest average list price for each of the 5 procedures we surveyed.
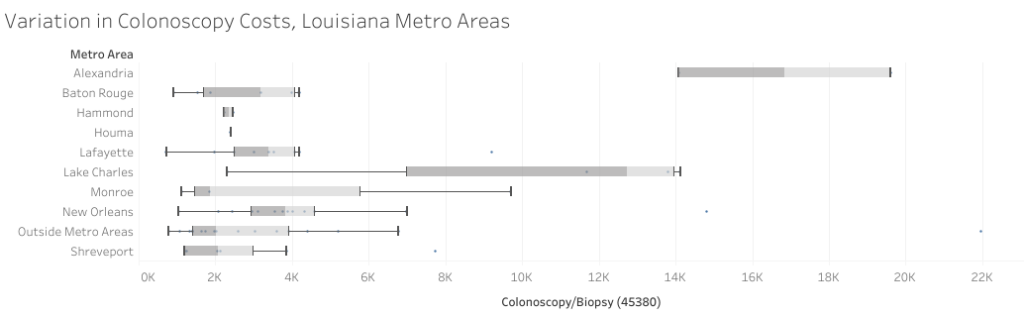
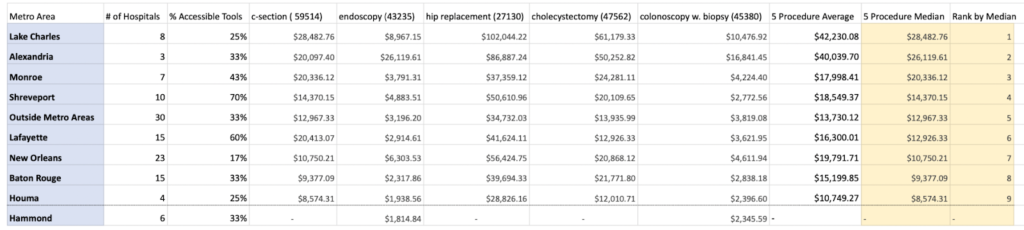
As in Arkansas, charges per procedure vary widely within all metro areas, nowhere more so than in Lake Charles.
Overall, Lake Charles had the highest charges for the five surveyed procedures. The highest gross charge for a cesarean section in Lake Charles is at Christus Ochsner Lake Area Hospital, $58,232.18, while the highest in Houma is at Ochsner Leonard J. Chabert Medical Center, $9,539.18. Majorities of hospitals in Lafayette (9 of 15) and Shreveport (7 of 10) had accessible price comparison tools, but in every other metro area and in rural areas, most hospitals’ tools were not accessible.
Texas
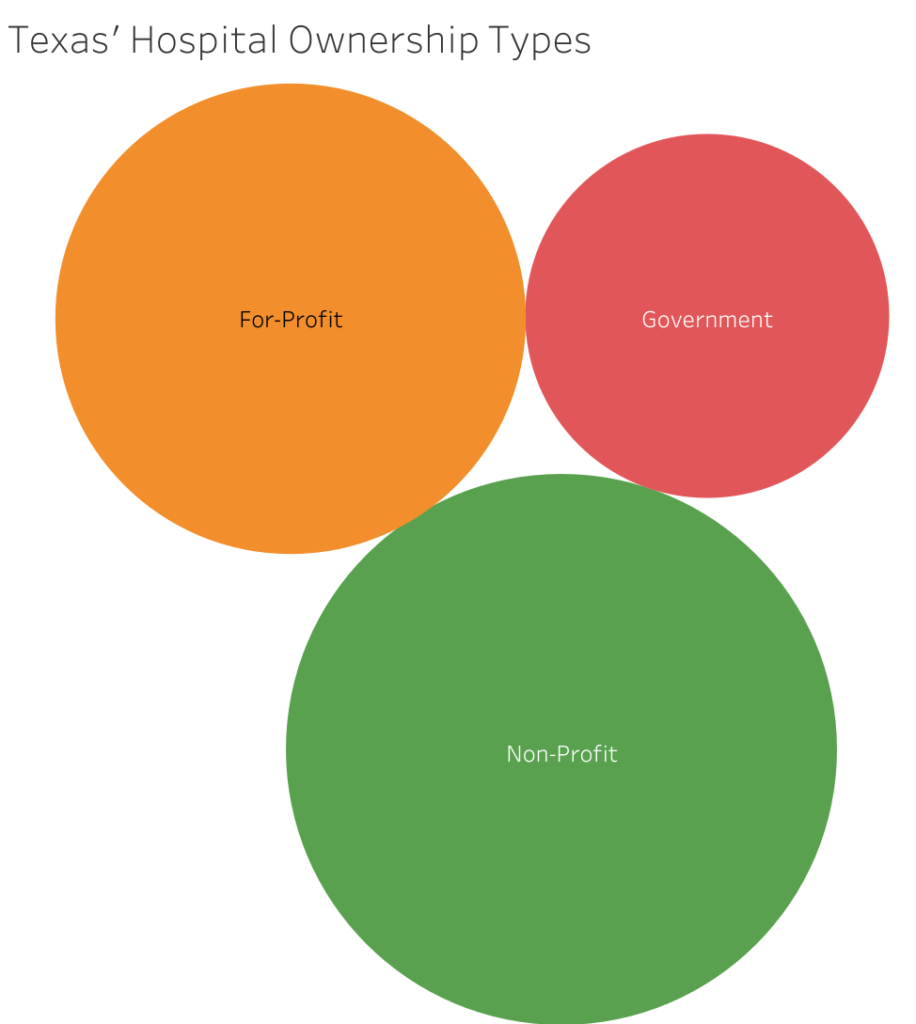
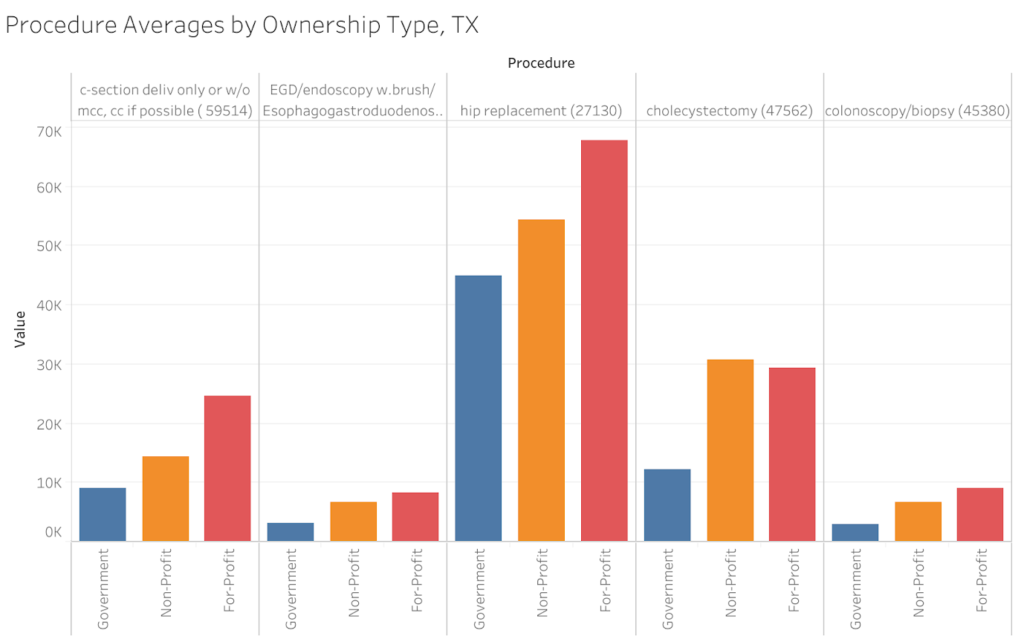
Of the three ownership types we categorized hospitals by, Texas’s set of 132 for-profit hospitals tended to have the highest charges, then its 181 non-profits, followed by its 79 government hospitals. The exception to this pattern was the laparoscopic gallbladder removal (cholecystectomy), for which non-profits had a higher average procedure charge.
The TexasHealth system deserves special scrutiny because the charges listed in its chargemasters were uniform across its locations, which seems incorrect given that each of its patient tool estimates differed significantly. Those estimates were also significantly higher than what was reported in the system’s machine-readable files. We opted for the high end of the tool estimations for this system.
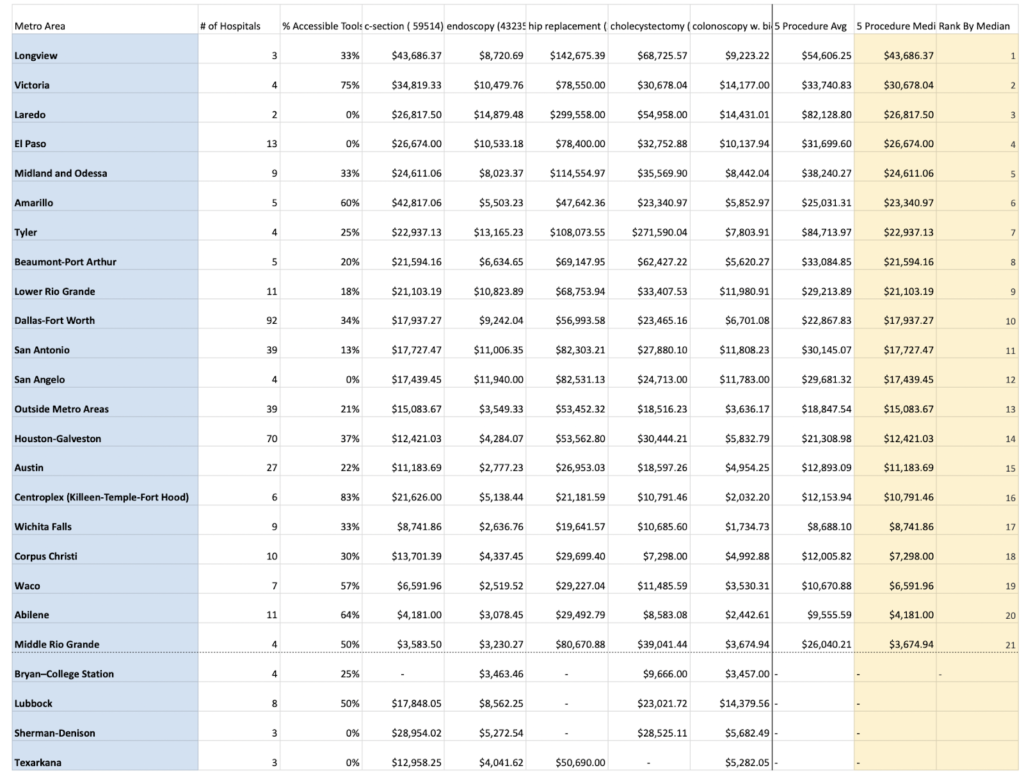
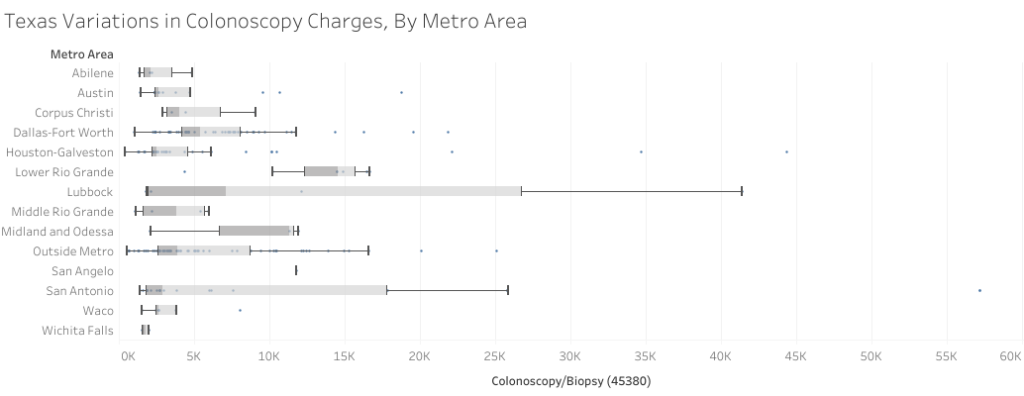
There were a few metro areas in Texas where a majority of hospitals had accessible price comparison tools: Victoria, Amarillo, Waco, and Abilene. The rest did not. Longview had the highest median charge, while Middle Rio Grande had the lowest. The lowest gross charge for a cesarean section in Longview is $35,838.73 (Christus Good Shepherd Medical Center Longview), while in the Middle Rio Grande it’s $2,286 (Dimmit Regional Hospital in Dimmit).
We had insufficient information from hospitals to report average costs in Bryan-College Station, Lubbock, Sherman-Denison, and Texarkana.
As in Arkansas and Louisiana, costs range widely within each metro area for every procedure, including for colonoscopies:
Acknowledgements
A team of dedicated researchers made this report possible: Ryann Cohen, Rebecca Srour, Meagan Lee, Alison Hurwitz, Yuan Yueyue, Amanda Castillo, Ana Bergmann, Gracie Scott, Emma Sciarrone, Amelia Nugent, Isabelle Varone, Anna Washburn, Orion Howard, Gabby Chavez, Pooja Patel, Setah Alavia, Trey Gray, Emily Thompson, Julia Stern, Kelsey Liebman, and Khayin Maheia.
David Thompson is research coordinator for the family of organizations that assembled this report, ACORN International, Labor Neighbor Research & Training Center, and Local 100 United Labor Unions. The full report and the data set is available at www.acorninternational.org and the websites of the partner organizations.
Questions on the report or more information can be obtained by email from David Thompson research@chieforganizer.org or from Wade Rathke chieforganizer@acorninternational.org who initiated the report as part of a series of similar reports published in Social Policy on the failure of hospitals to provide charity care as required by the Affordable Care Act and the more recent report in Social Policy 51.4 on non-compliance with this CMS reporting requirement.
Take Action and Follow-Up
If you need help making it through the maze that we have described, contact us at www.acorninternational.org, www.laborneighbor.org, or www.unitedlaborunions.org for assistance!
1 Chernew, Michael and Harrison Mintz, “Administrative Expenses in the US Health Care System: Why So High?” https://jamanetwork.com/journals/jama/fullarticle/2785479
2 Himmelstein, Campbell, Woolhandler, “Health Care Administrative Costs in the United States and Canada,” Annals of Internal Medicine. https://pubmed.ncbi.nlm.nih.gov/31905376/3 https://www.politico.com/agenda/story/2016/07/what-is-the-effect-of-obamacare-economy-000164/
4 See, e.g., Louisiana’s Lake Charles Memorial Hospital’s chargemaster, which lists some 52 prices for spinal fusion, or Madison Parish Hospital in Tallulah, Louisiana which lists just one.
5https://www.nytimes.com/2017/03/29/magazine/those-indecipherable-medical-bills-theyre-one-reason-health-care-costs-so-much.html
6 https://www.cms.gov/files/document/steps-machine-readable-file.pdf
7 https://www.youtube.com/watch?v=LdX3Kny6lLk
8 Kliff, Sarah and Josh Katz, “Hospitals and Insurers Didn’t Want You To See These Prices. Here’s Why,” August 22, 2021. https://www.nytimes.com/interactive/2021/08/22/upshot/hospital-prices.html9 For instance, this excellent study shows how wildly prices can vary for the same procedure in certain metro areas: https://www.healthsystemtracker.org/brief/price-transparency-and-variation-in-u-s-health-services/
10 https://acorninternational.org/index.php/2021/11/30/complaints-filed-178-hospitals-fail-to-provide-federally-mandated-price-transperency/
Eleven (11) of the seventeen (17) counties provided sufficient information to make determinations. 49.1% of the Arkansas population is male, and 50.9% are female. Of the board members of Arkansas cooperatives 90.4% are men, and 9.6% are women.
Racially, 74.5% of the state is white, 15.6% is black, and 7% are Hispanic. Of the identifiable board members in any level of governance, 97.8% are white, and 2.2% are black, and none are Hispanic. On the eleven (11) counties where we were able to verify information, there was no picture of one board member for Mississippi County Electric, but we counted the unknown board member as African-American. Mississippi County is 35.5% African-American. Either there is one (1) or none (0)
in terms of African-American representation on the governance of this cooperative. If he is African-American, we cannot explain why his picture was missing. If we had not counted Mississippi accordingly, there would have been only one (1) verifiable African-American cooperative board member in the state.
Arkansas Valley Electric
Ashley-Chicot Electric
C&L Electric
Carroll Electric
Clay County Electric
Craighead Electric
Farmers Electric
First Electric Cooperative
Mississippi County Electric
North Arkansas Electric
Ouachita Electric
Ozarks Electric
Petit Jean Electric
Rich Mountain Electric
South Central Arkansas Electric Coop
Southwest Arkansas Electric
Woodruff Electric Cooperative
Labor Neighbor has applied for noncommercial radio stations to further the mission of giving under represented voices a place on the air.These licenses are largely in underserved, rural areas where these voices need to be heard so that people can act accordingly.
The Federal Communications Commission (FCC) receives these applications and determines the award for licenses and construction permits.Five of our applications have been accepted by the FCC, so we are required to post this publicly on our website for no less than five (5) days, as we are doing beginning January 14, 2022.
The information regarding the relevant applications is listed below:
On 01/10/22, Labor Neighbor of 90.7, Kersey, CO, filed an application with the Federal Communications Commission for FM Noncommercial. Members of the public wishing to view this application or obtain information about how to file comments and petitions on the application can visit File Number: 0000167263.
On 01/10/22, Labor Neighbor of 89.9, Limon, CO, filed an application with the Federal Communications Commission for FM Noncommercial. Members of the public wishing to view this application or obtain information about how to file comments and petitions on the application can visit File Number: 0000167257.
On 01/10/22, Labor Neighbor of 91.3, Cimarron, NM, filed an application with the Federal Communications Commission for FM Noncommercial. Members of the public wishing to view this application or obtain information about how to file comments and petitions on the application can visit File Number: 0000167266.
On 01/10/22, Labor Neighbor of 89.3, Hope, NM, filed an application with the Federal Communications Commission for FM Noncommercial. Members of the public wishing to view this application or obtain information about how to file comments and petitions on the application can visit File Number: 0000167261.
On 01/10/22, Labor Neighbor of 89.9, Eudora, AR, filed an application with the Federal Communications Commission for FM Noncommercial. Members of the public wishing to view this application or obtain information about how to file comments and petitions on the application can visit File Number: 0000167262.
officially the Democratic Socialist Republic of Sri Lanka, is an island country in South Asia, located in the Indian Ocean to the southwest of the Bay of Bengal and to the southeast of the Arabian Sea. The island is historically and culturally intertwined with the Indian subcontinent, but is geographically separated from the Indian subcontinent by the Gulf of Mannar and the Palk Strait. The legislative capital, Sri Jayawardenepura Kotte, is a suburb of the commercial capital and largest city, Colombo.
Sri Lanka’s documented history spans 3,000 years, with evidence of pre-historic human settlements dating back to at least 125,000 years.[10] It has a rich cultural heritage and the first known Buddhist writings of Sri Lanka, the Pāli Canon, date back to the Fourth Buddhist council in 29 BC.[11][12] Its geographic location and deep harbors made it of great strategic importance from the time of the ancient Silk Road through to the modern Maritime Silk Road.[13][14][15]
The current constitution stipulates the political system as a republic and a unitary state governed by a semi-presidential system. It has had a long history of international engagement, as a founding member of the South Asian Association for Regional Cooperation (SAARC), and a member of the United Nations, the Commonwealth of Nations, the G77, and the Non-Aligned Movement. Along with the Maldives, Sri Lanka is one of only two South Asian countries rated “high” on the Human Development Index (HDI), with its HDI rating and per capita income the highest among South Asian nations.[7] The Sri Lankan constitution accords Buddhism the “foremost place”, although it does not identify it as a state religion. Buddhism is given special privileges in the Sri Lankan constitution.[17]
The island is home to many cultures, languages and ethnicities. The majority of the population is from the Sinhalese ethnicity, while a large minority of Tamils have also played an influential role in the island’s history. Moors, Burghers, Malays, Chinese, and the indigenous Vedda are also established groups on the island.
The various ethnic groups united to end British colonial rule, but the British legacy insisted on communal representation that eventually pitted the majority Sinhalese against the minority (over 800,000) Tamil leading to civil war in 1983 over a number of issues involving language and jobs, including provisions that made the Tamil virtually stateless and unable to obtain citizenship in the emerging nation. The Tamil Tigers was a well-known guerilla effort classified as terrorist by many nations. Attempts at peace broke down a number of times until after more than twenty-five years with the help of the Indian army a military victory was achieved over the Tamil in 2009.
More recently, Sri Lanka was in the news over a constitutional crisis involving the president, prime minister, and parliament in the fall of 2018. A popular prime minister accused of corruption was ousted by a political coalition that elected the president who after several years in office suddenly returned the former prime minister to that job triggering mayhem. Eventually, he was force to resign in the stalemate between the president of the parliament.
The Organizers’ Forum is interested in meeting with a number of groups in order to evaluate the progress of the country a decade after its civil war as it tries to resolve the historic issues that have divided its people and undercut its institutions. A delegation from the Organizers’ Forum had undertaken a similar mission a decade after the end of apartheid in South Africa in order to understand how deeply change had become embedded and shaped the country’s future. Similarly, the Organizers Forum delegation in Indonesia was able to view the impacts of ethnic strife in that country that had experienced state terror during the Cold War and how it had adapted in unique ways.
In this time when the issue of climate change has global importance, the Organizers’ Forum is also hoping to learn more about how an island nation like Sri Lanka is making plans to deal with the potential impact of rising seas. Some members of the delegation have discussed a side trip to the Maldives in order to see that country “while it’s still there,” since many scientists also project that by the end of the century it could be underwater.
Long thought of as an exotic country, Sri Lanka is now at the crossroads of a different kind of future, and the Organizers Forum delegation is seeking to better understand what we have to learn – and to offer – at this critical juncture.
The Organizers’ Forum is a project of the Labor Neighbor Research & Training Center. Interested parties need to contact director@laborneighbor.org in order to reserve a place. The Forum covers housing, most meals, and in-country transportation and events, while members of the delegation and their organizations cover transportation to and from Sri Lanka and cover a modest program fee that allows from planning and logistics to make this trip happen. Please contact us at your earliest convenience and certainly not later than August 1st. As always, the earlier plane reservations are made, the cheaper for the delegates.
A visa is required to North American, UK, and European visitors that costs about $30 USD and is available electronically within three working days or at the airport, but best advice is getting it earlier.
LNRTC is working with Alliance for a Just Society on releasing a report in Texas on Breaking Barriers: Improving Health Insurance Enrollment and Access to Health Care in Texas. Link to the Report is available here Breaking Barriers Texas Report